Transit Impact Report
The Transit Impact Report gives a simple snapshot of how many people we’re supporting, the types of households we see and how local needs are changing. It helps us understand our community and shows the difference your support makes.
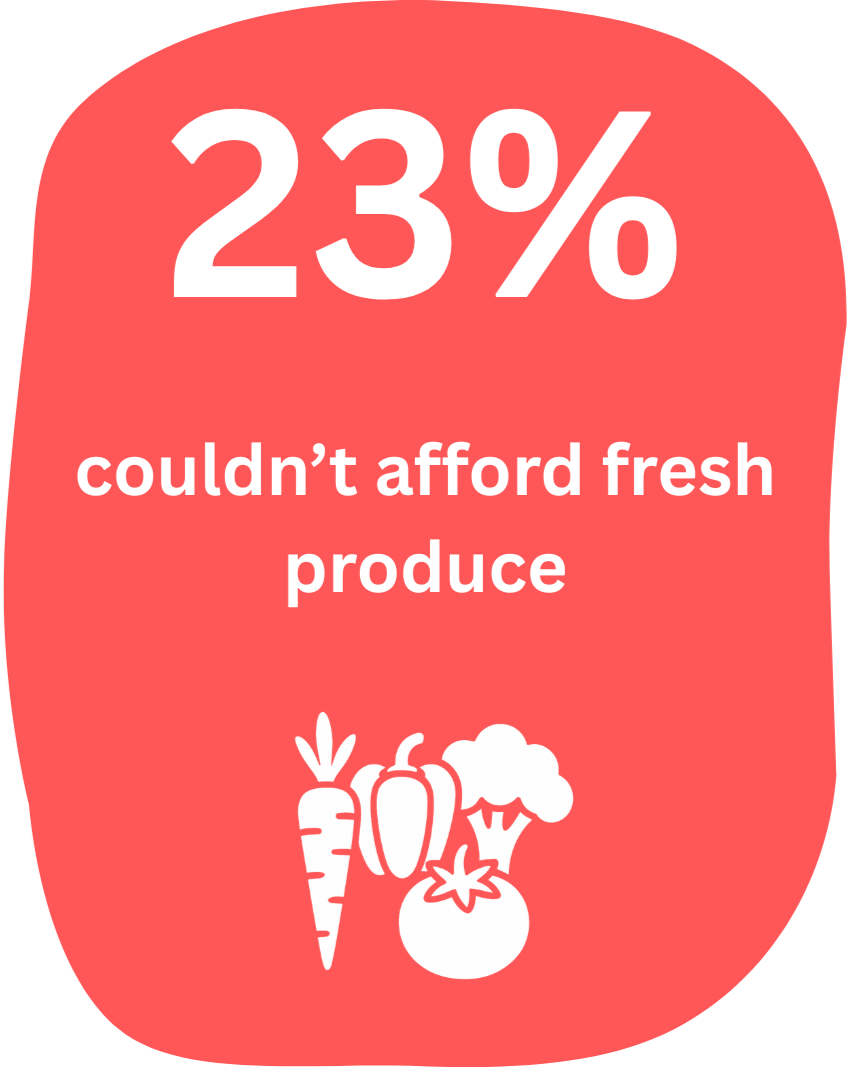
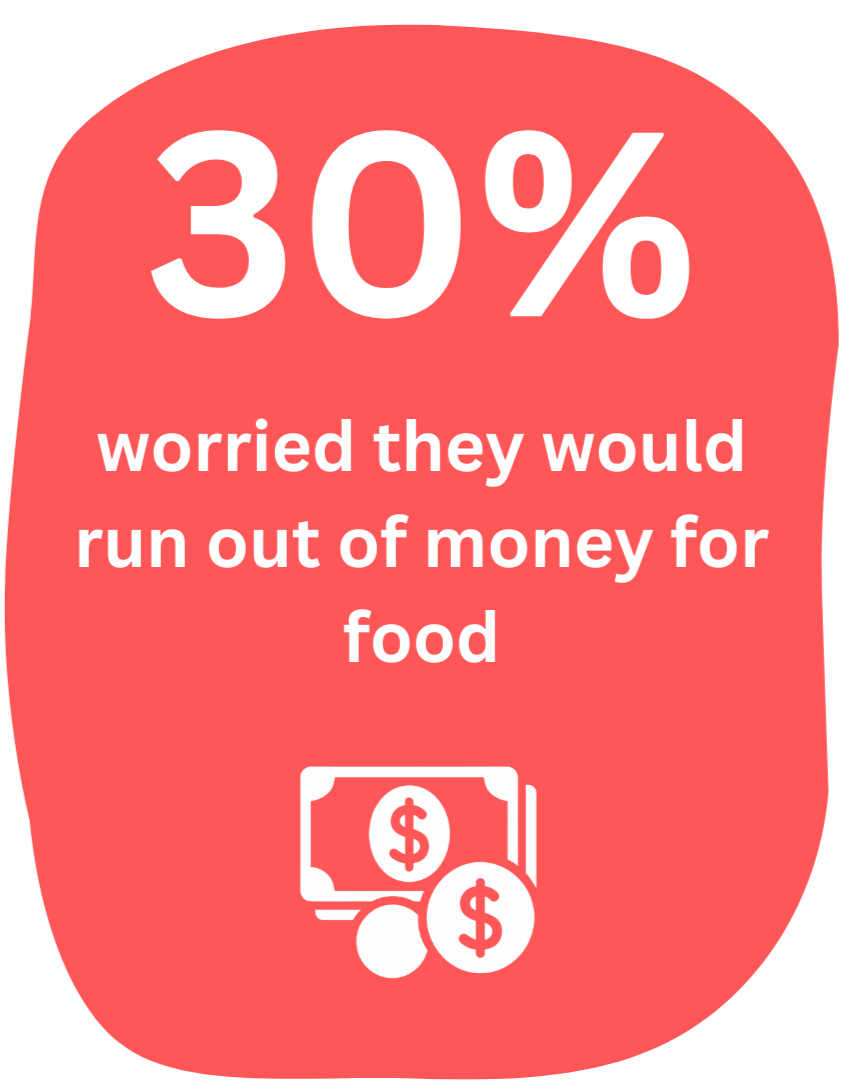
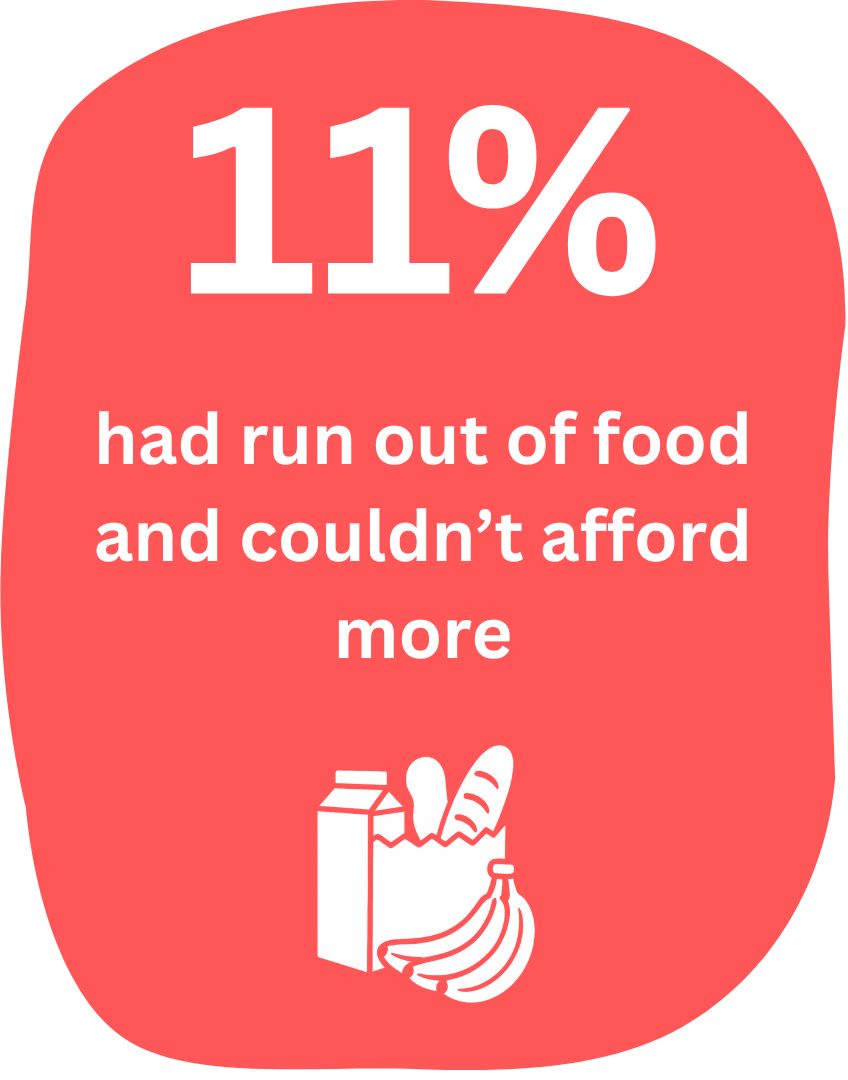
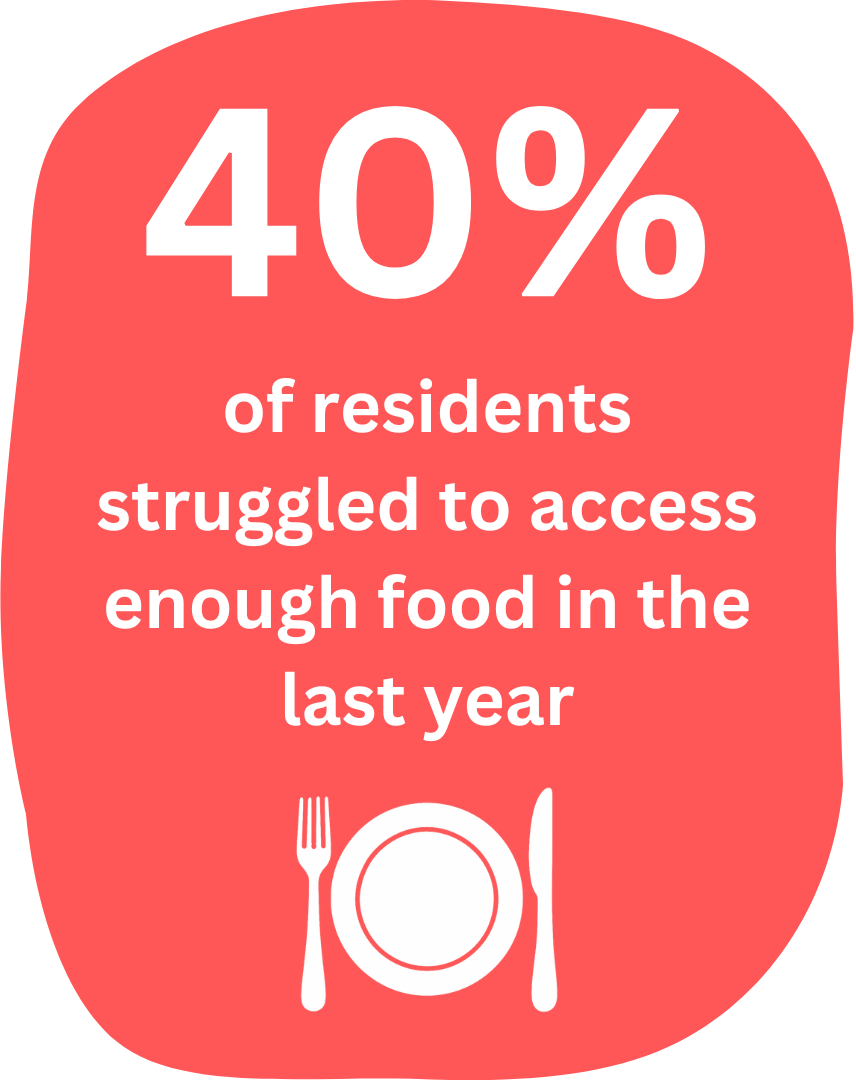
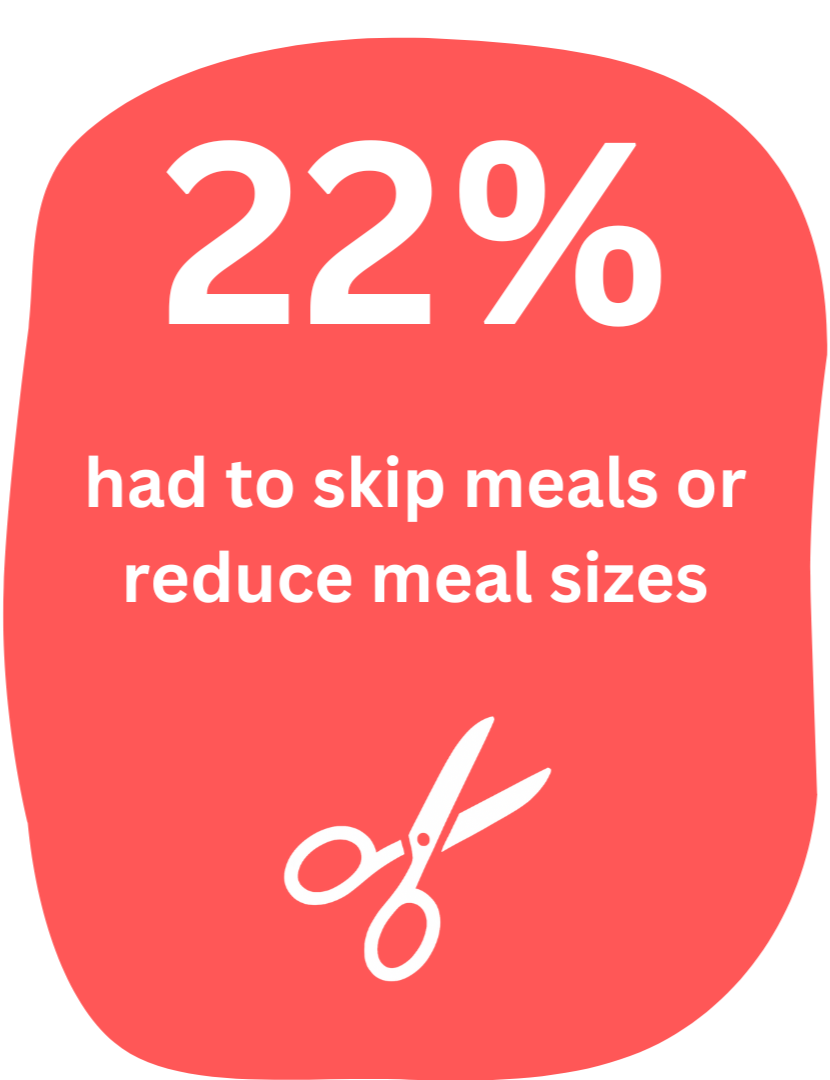
The City of Casey is one of Australia’s fastest-growing areas, home to more than 405,000 people from over 150 cultural backgrounds. But the 2024 City of Casey Household Survey showed that food insecurity is a major issue.
This is not a short-term problem for many households - it’s an ongoing challenge affecting wellbeing, stability and the ability to thrive.
Our Community at a Glance

Photo taken with permission of Guest
Guest Engagement: Who We’re Supporting at Transit and Who No Longer Needs Food Assistance (2025)
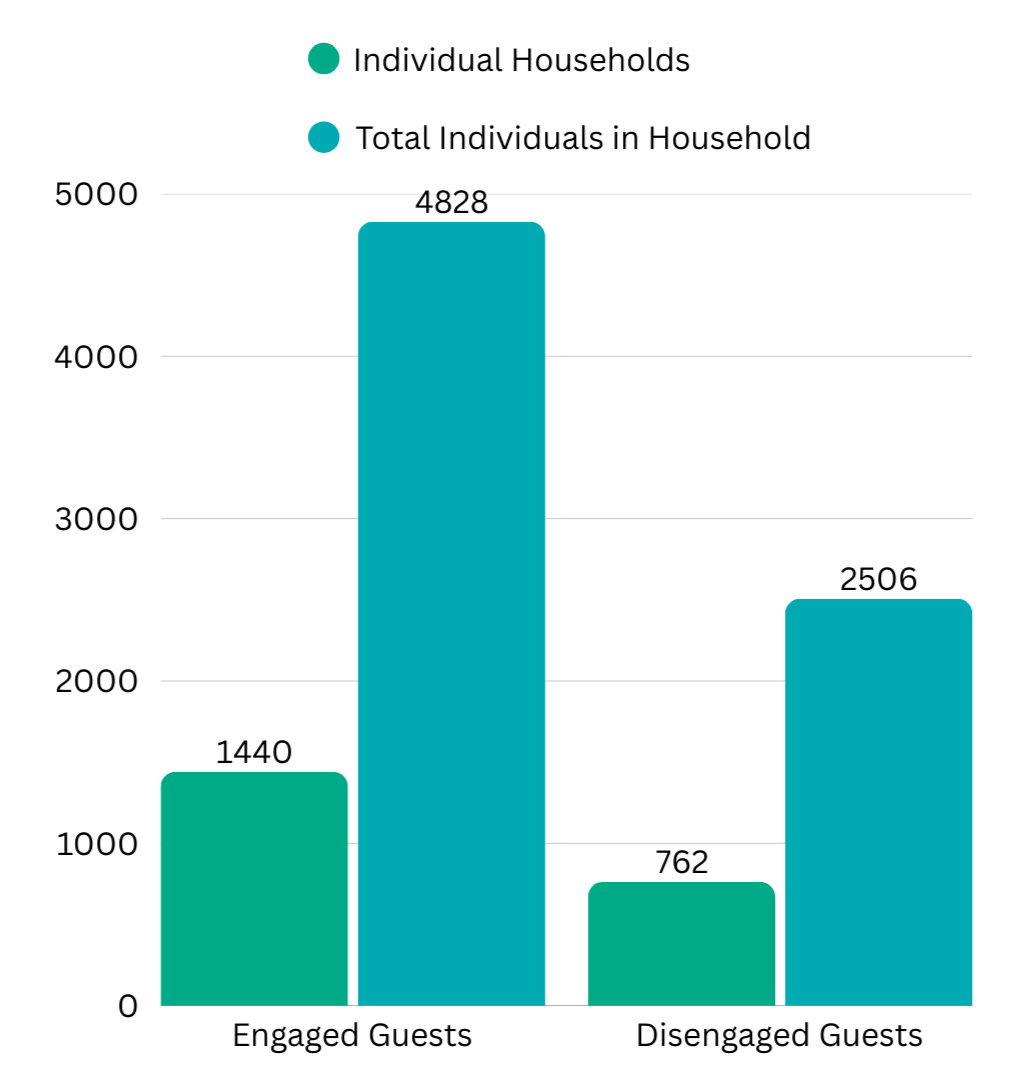
This graph highlights the difference between guests who are actively engaged with our services and those who are no longer reliant on food support from Transit (disengaged guests).
What does ‘disengaged’ mean?
At Transit, a ‘disengaged’ guest is someone who no longer relies on our food support. While many people reduce visits as life becomes more stable - such as gaining employment, moving further away, improving finances, or simply no longer needing regular food assistance - we can only track that they have stopped attending, not why. Some later tell us they’ve gotten back on their feet and a few even return as volunteers as their way of giving back.
A note on the data…
We can clearly see when a guest’s attendance gradually decreases and eventually stops, but we can’t capture the personal reason behind that change. The closest insights we gain are through occasional case studies or when people reconnect years later and share their story. For this reason, the data reflects the pattern of engagement rather than the individual circumstances behind it.
Guest Engagement: (Homeless / Rough Sleepers)

The homelessness trend across 2023, 2024, and 2025.
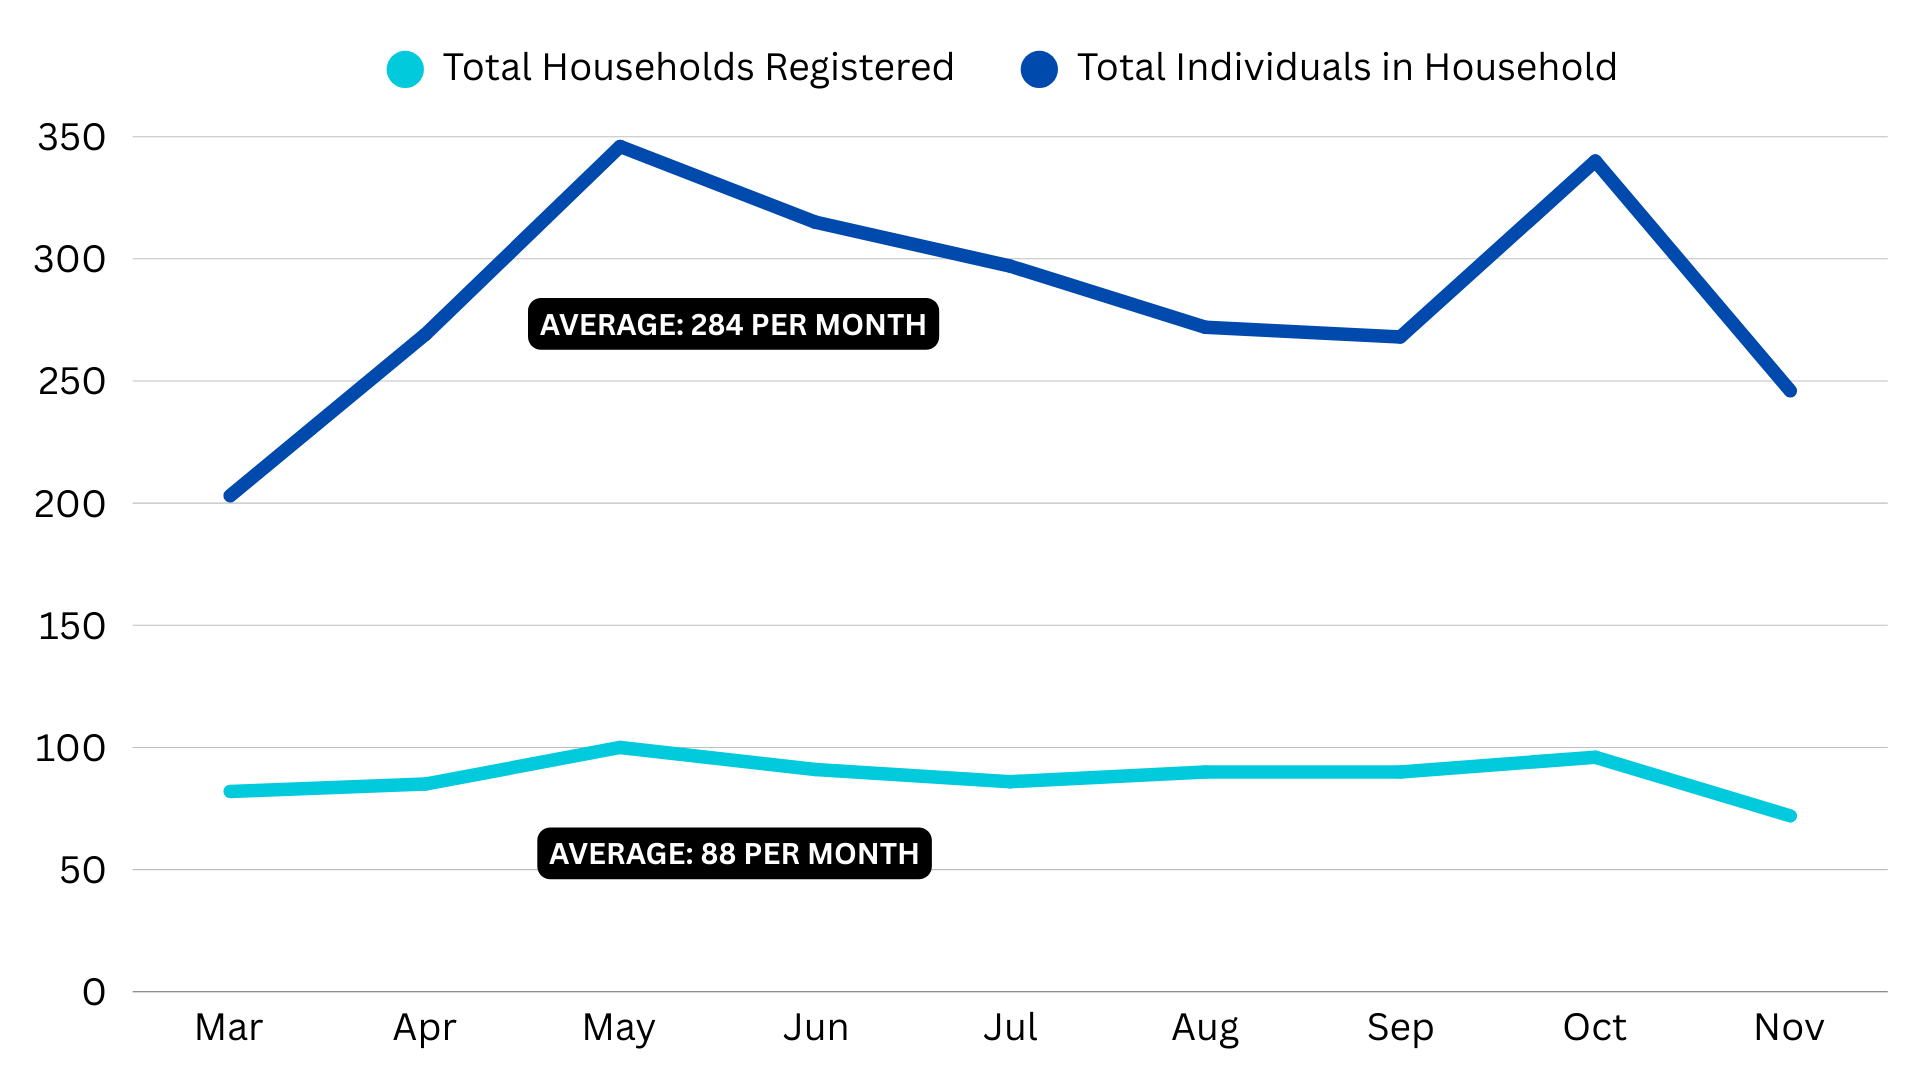
Who’s New to Transit in 2025?

This graph shows how many new guests we registered each month in 2025, including both households and the adults and children within them. It doesn’t include people who come along for our community meals on Mondays and Wednesdays.
New Guest Registrations (2025)
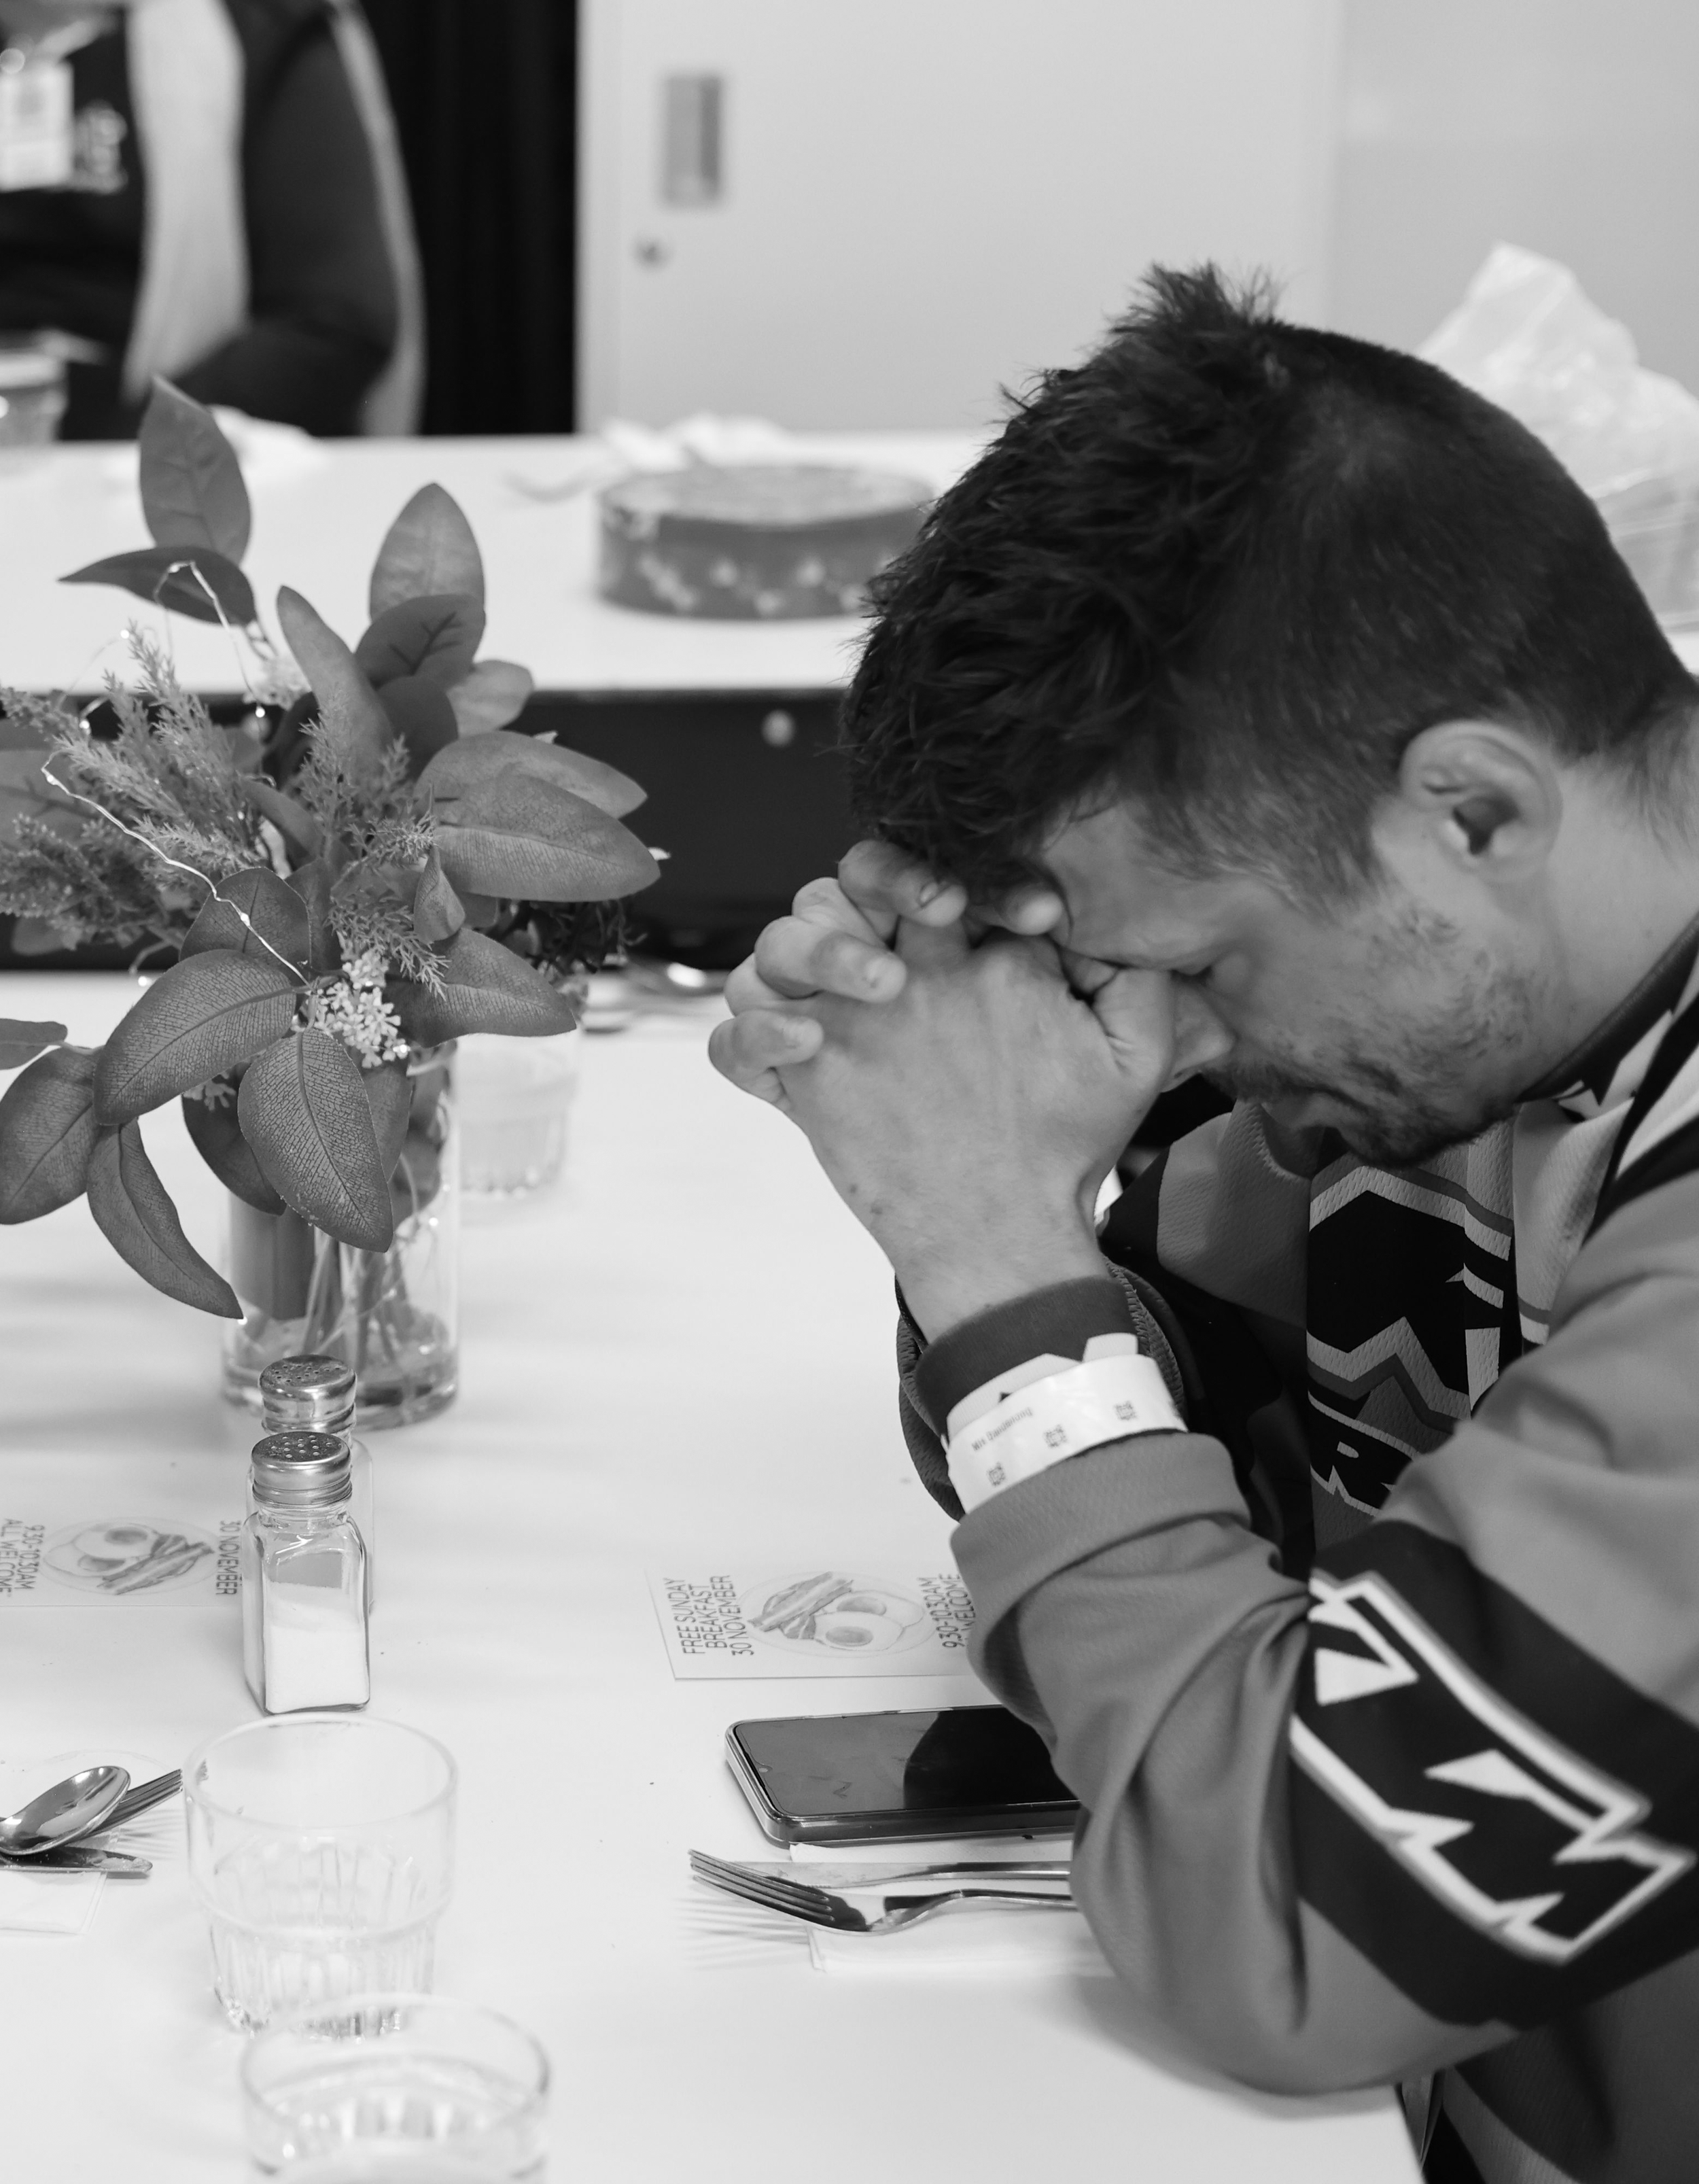
Photo taken with permission of mother
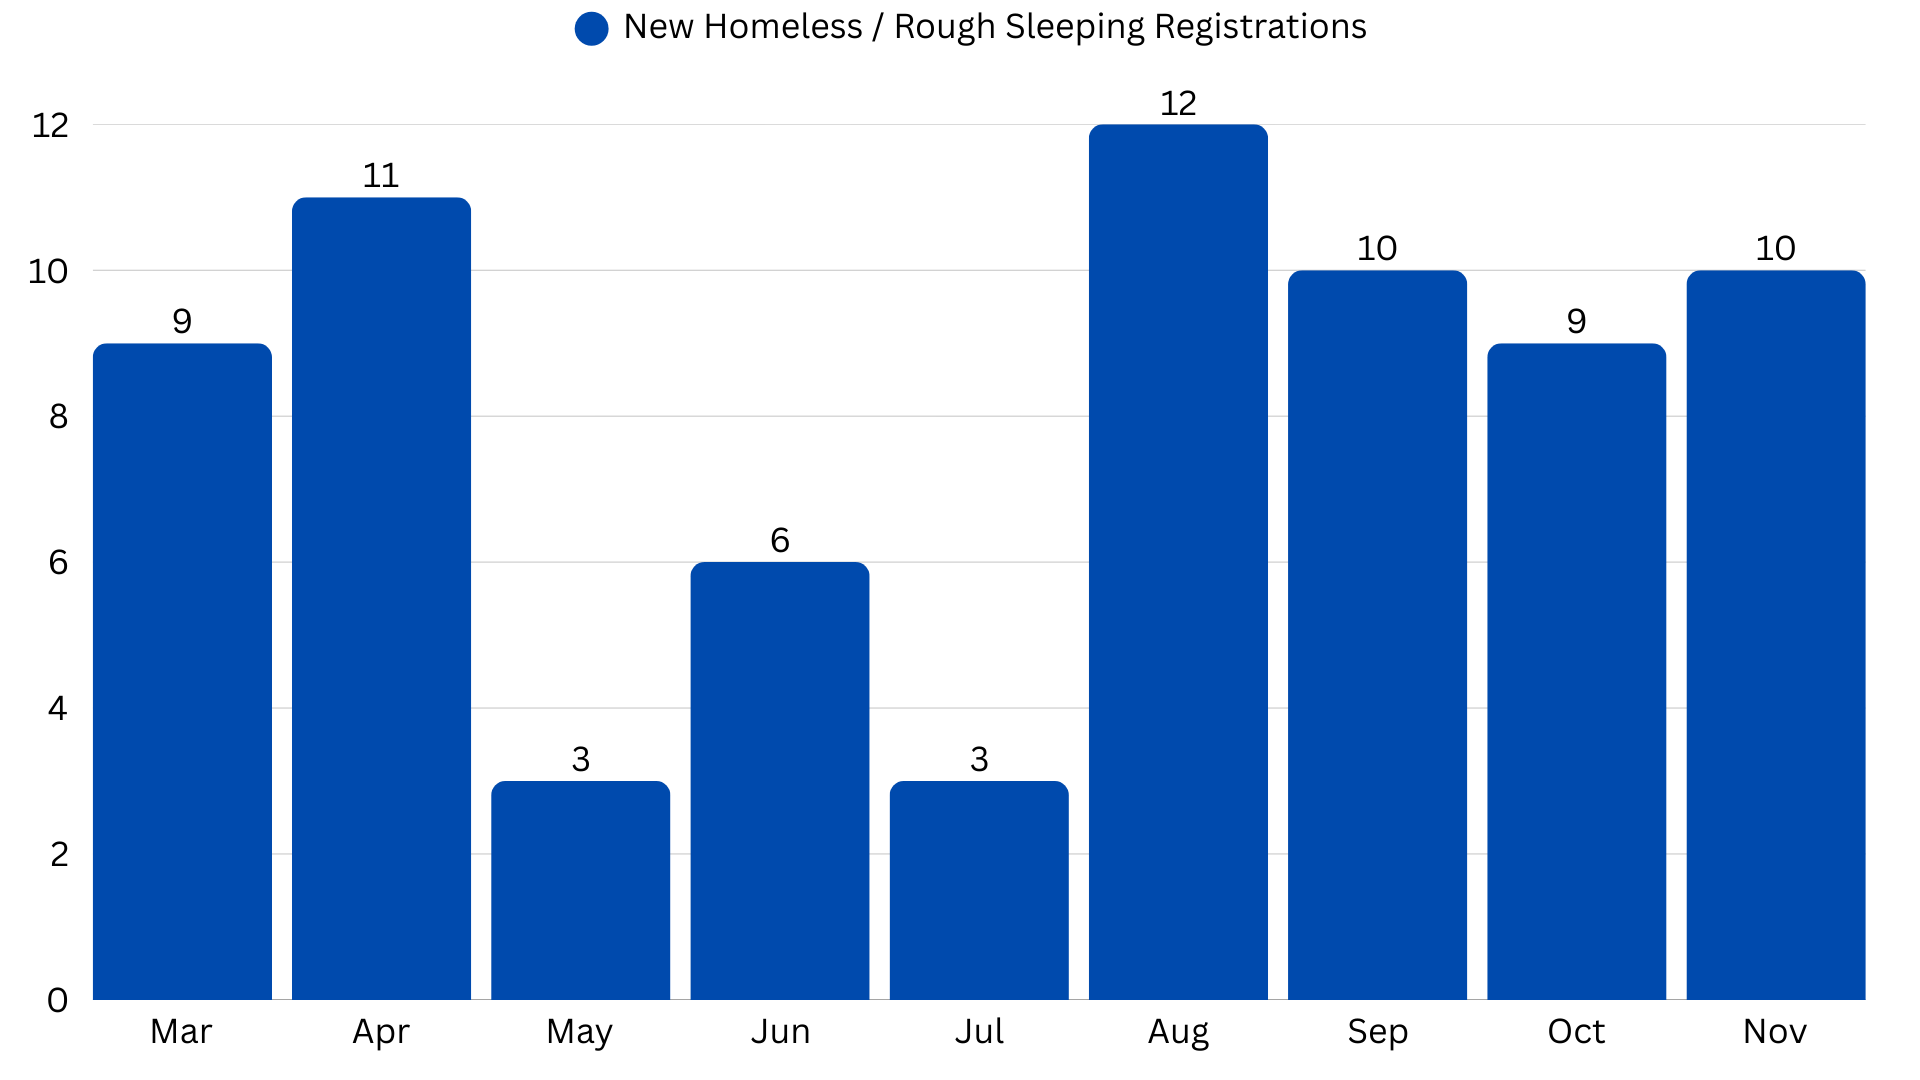
This graph compares how many new guests we registered each month in 2025, focusing on individuals experiencing homelessness or rough sleeping.
New Guest (Homeless / Rough Sleepers) Registrations (2025)
New Guest Registrations by Household Composition (2025)
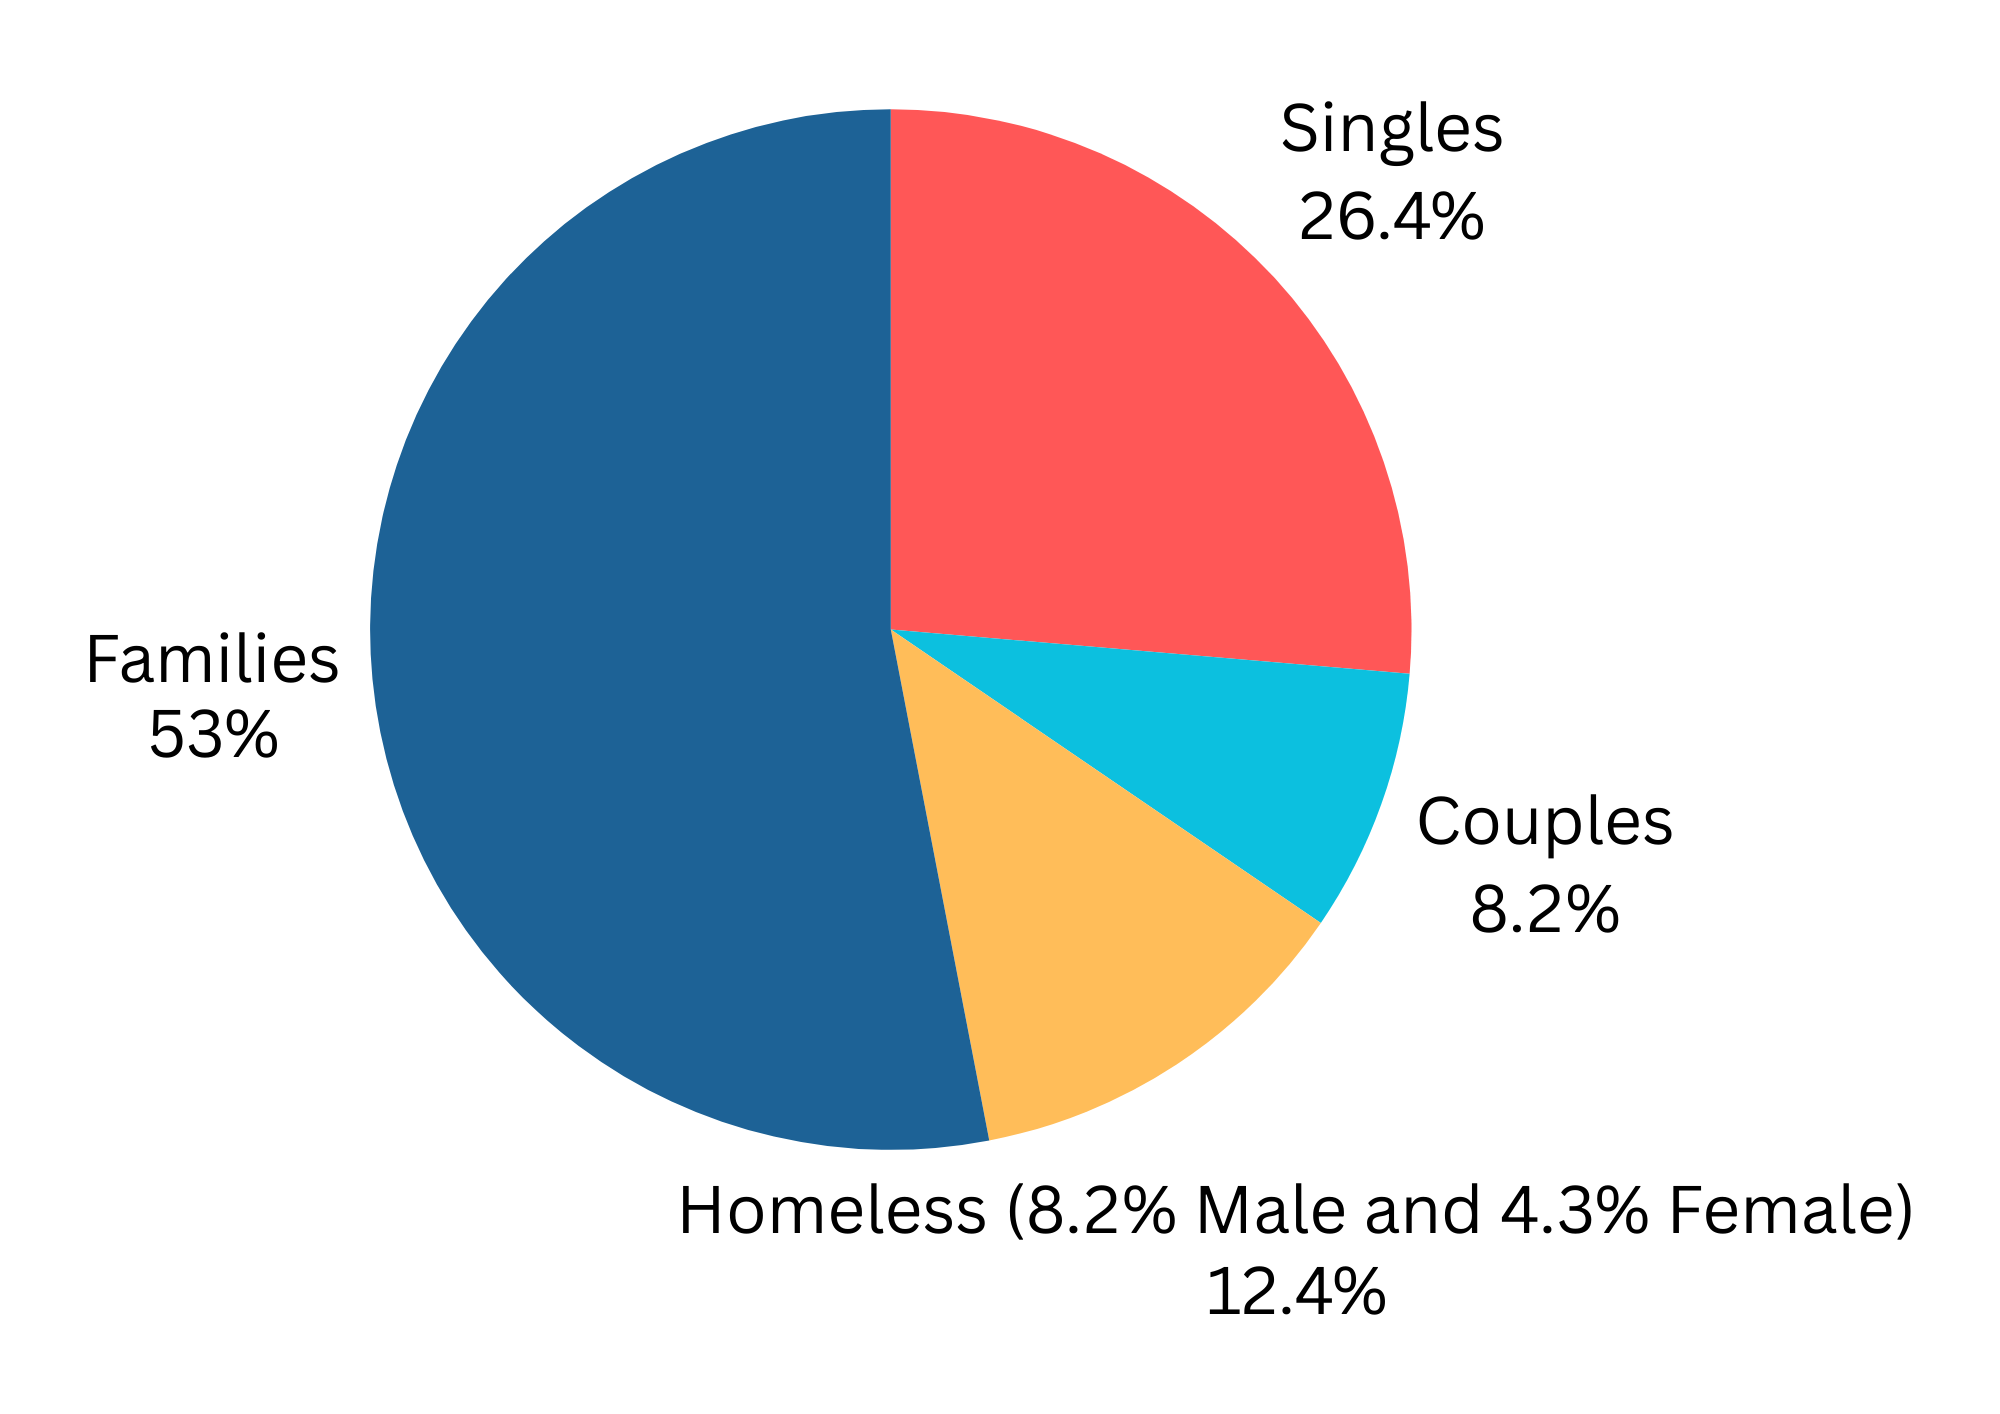
A breakdown of household compositions among first-time Transit registrations in 2025.
New Guest Registrations by Location (2025)
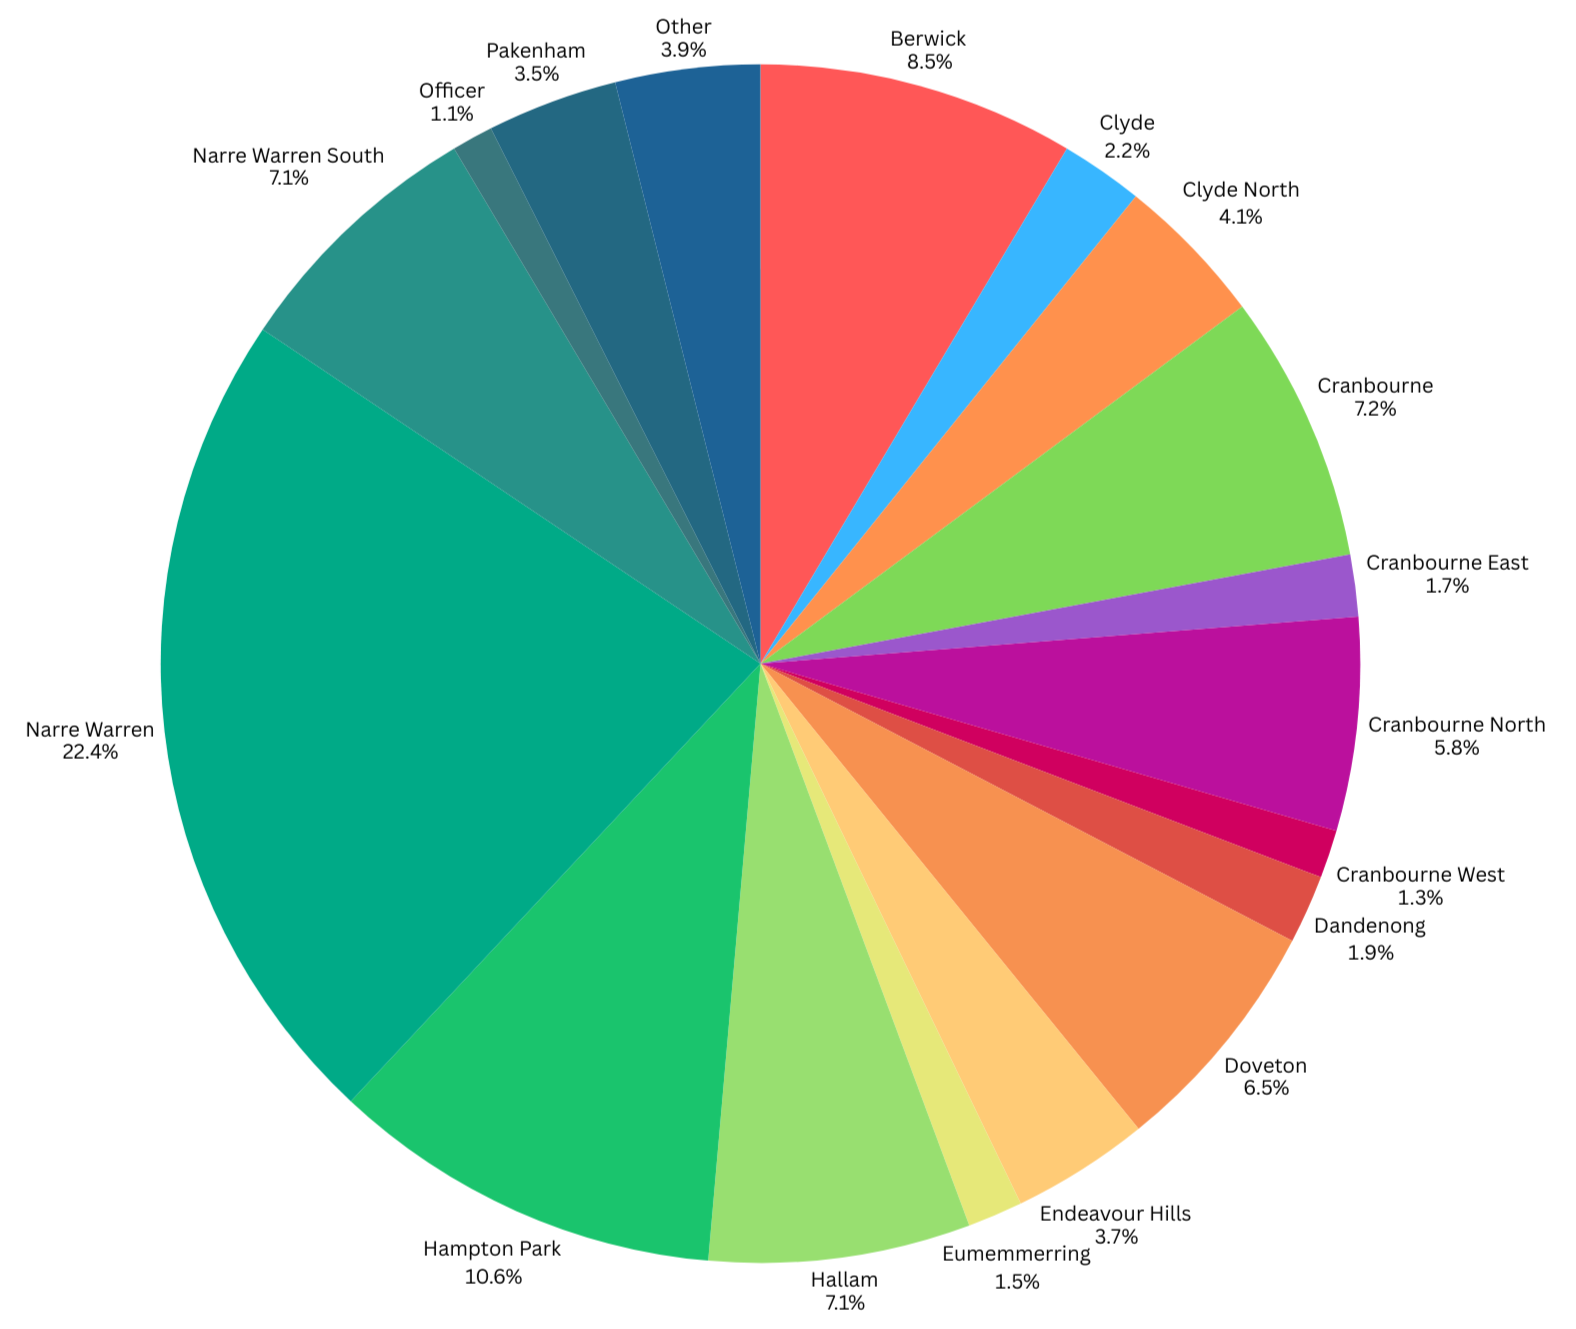
A breakdown of suburb distribution.
Our Guests' Journey
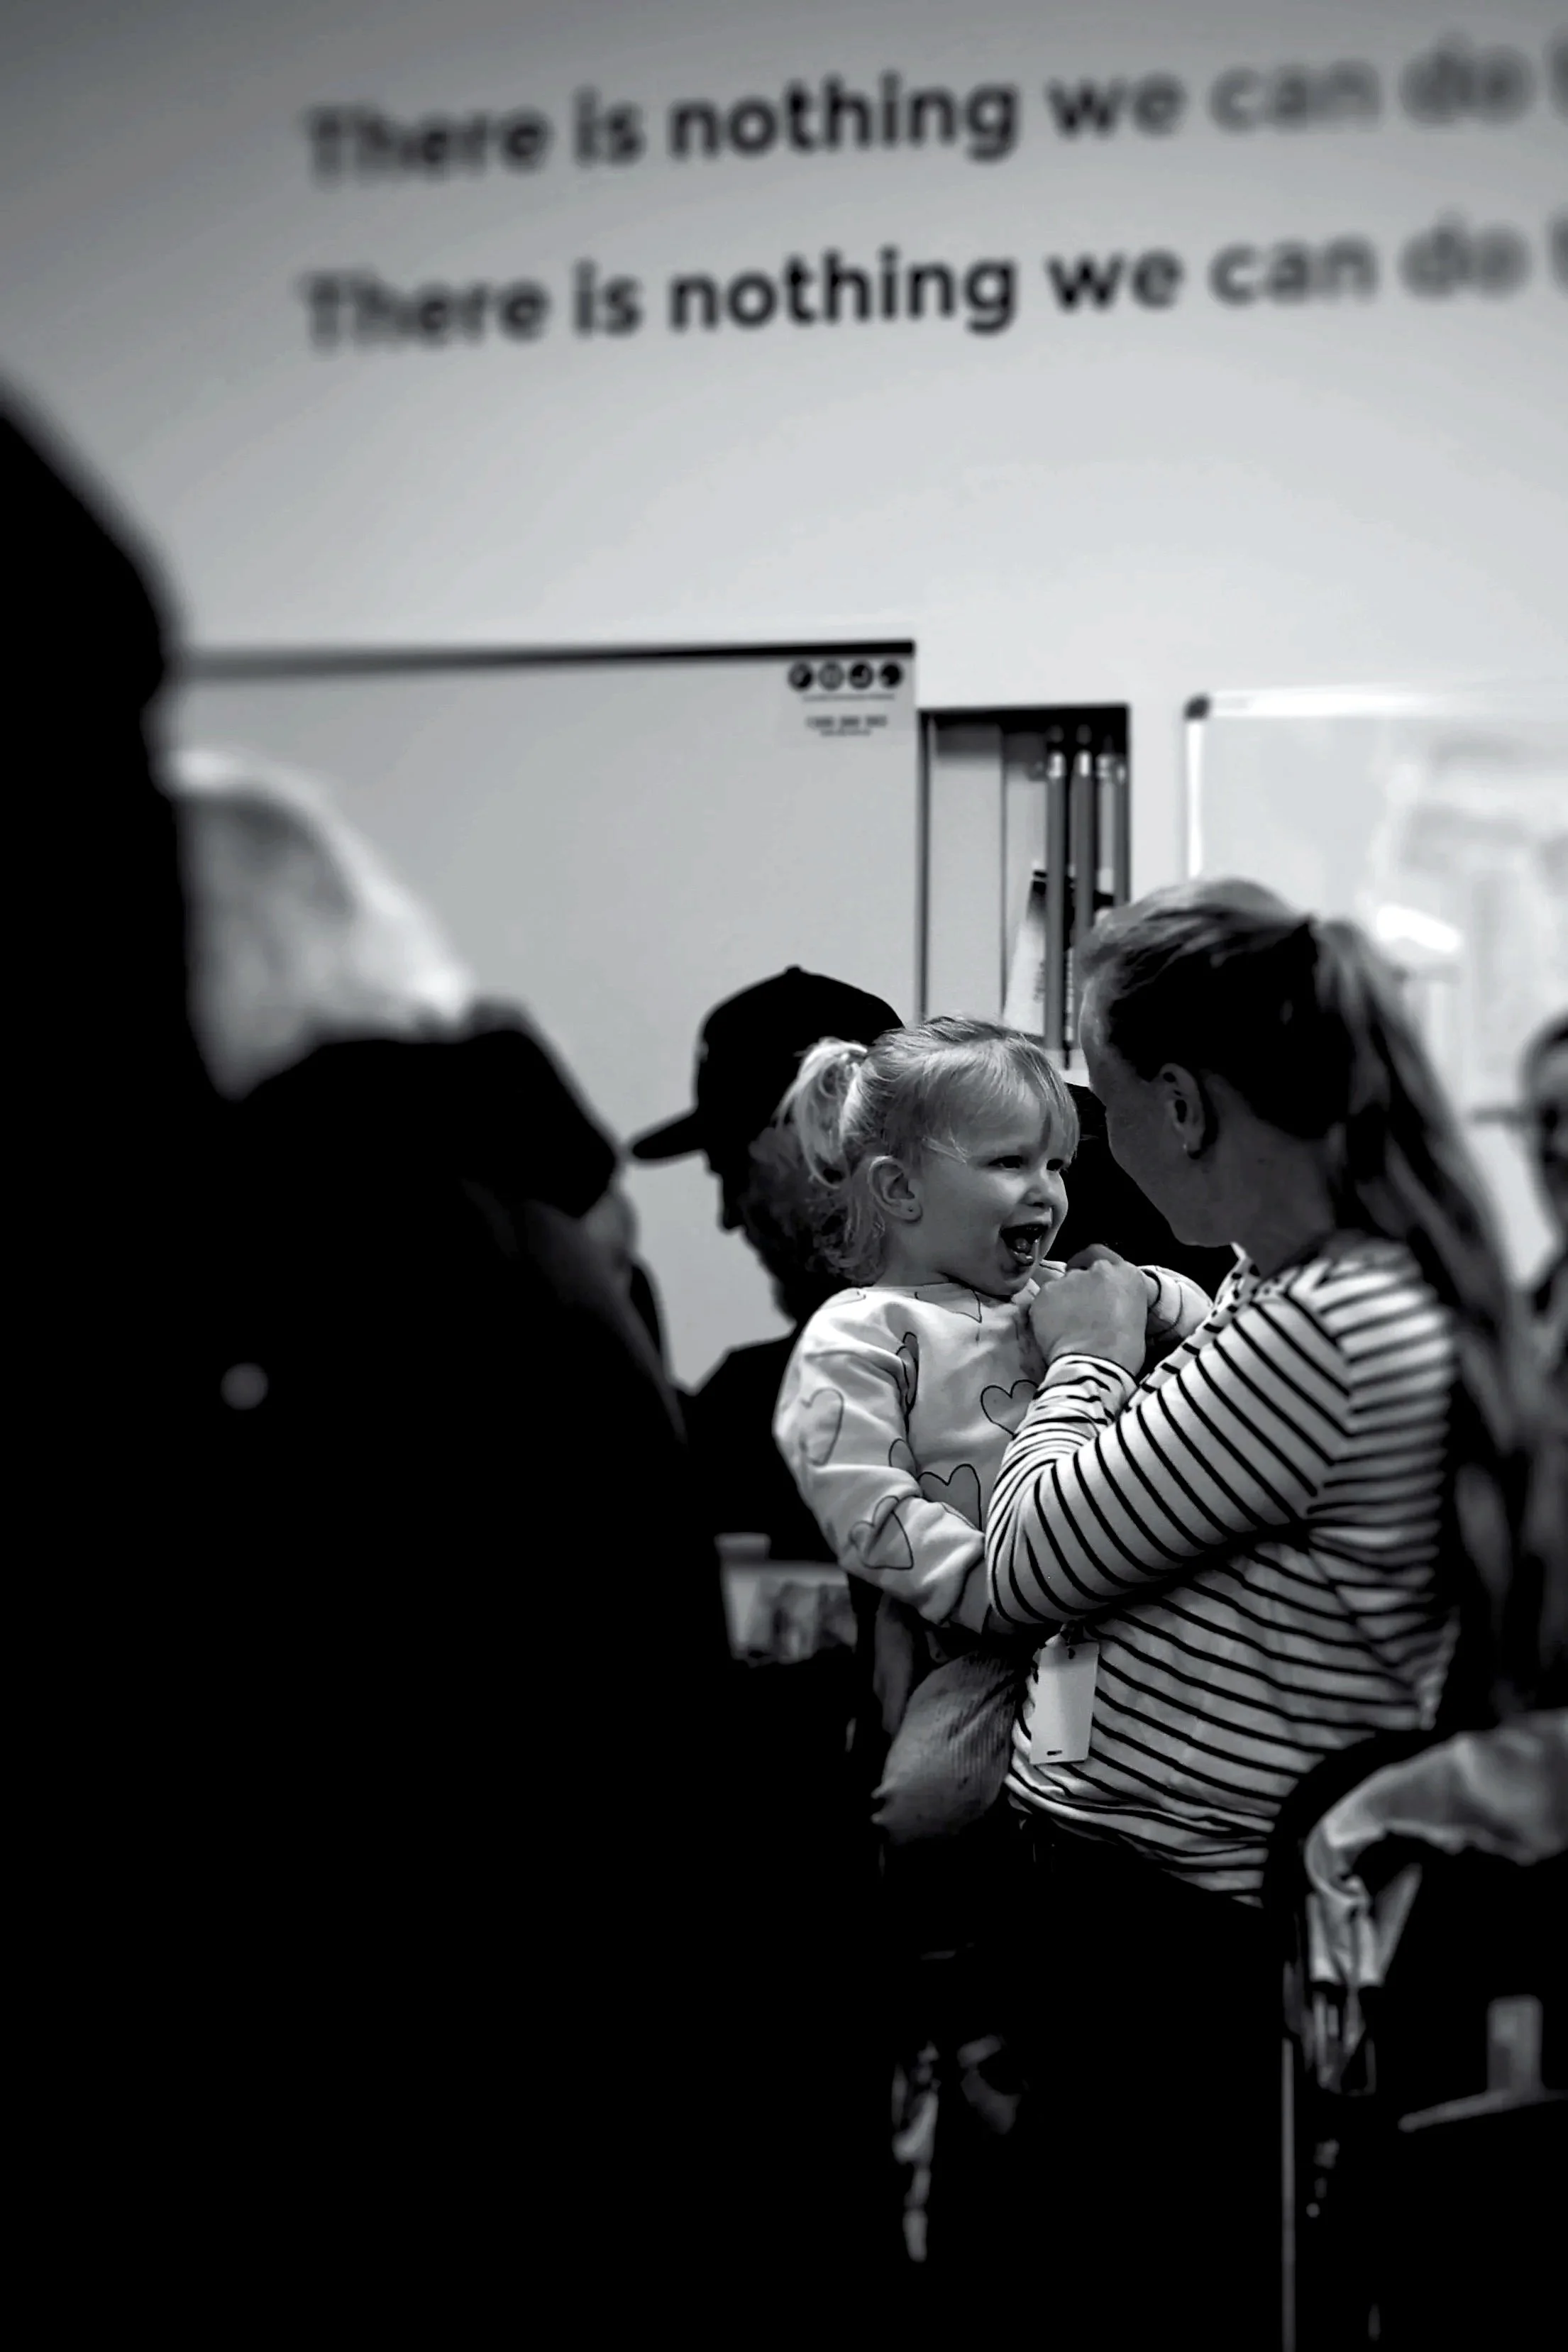
Photo taken with permission
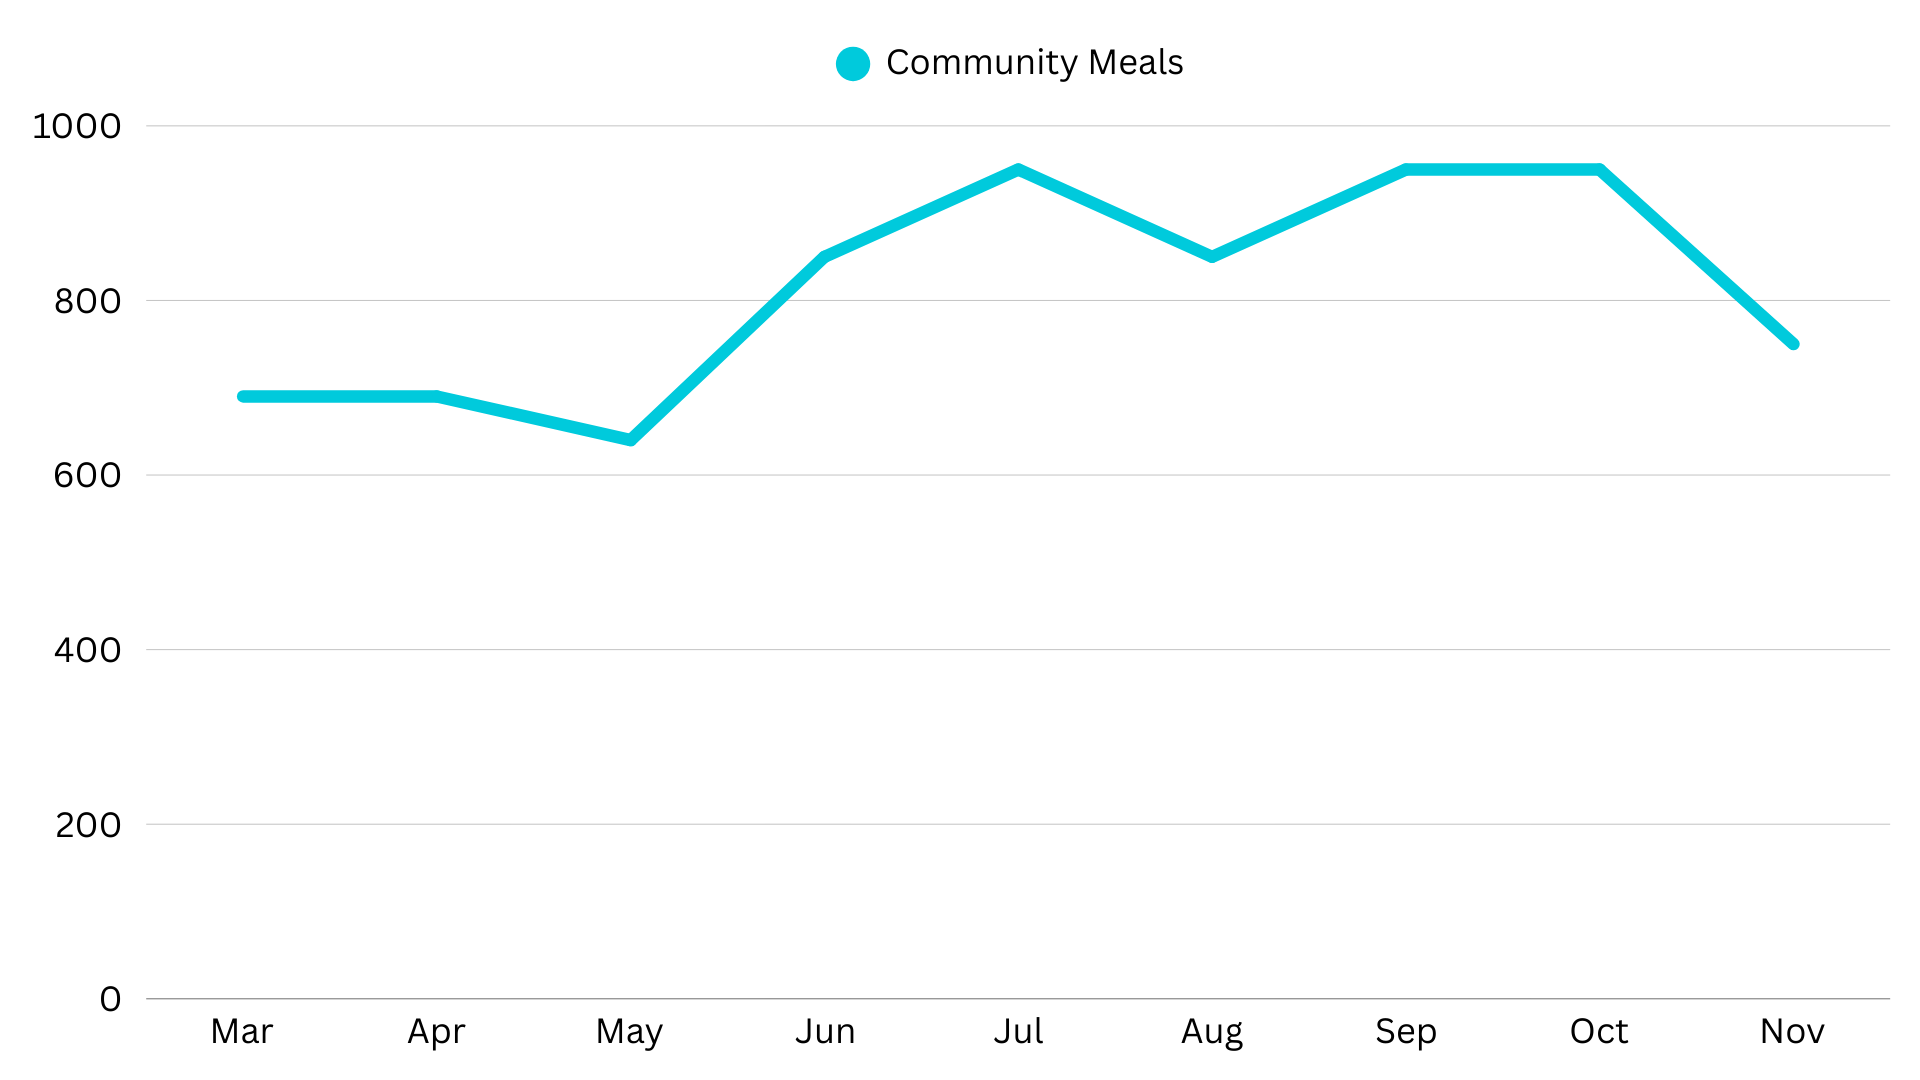
Our community meals service continues to provide support, companionship and nourishment to hundreds of individuals each month. Whether facing difficult times, loneliness or simply seeking social connection, this space is open to all.
Our Sit-Down Meal Service (2025)
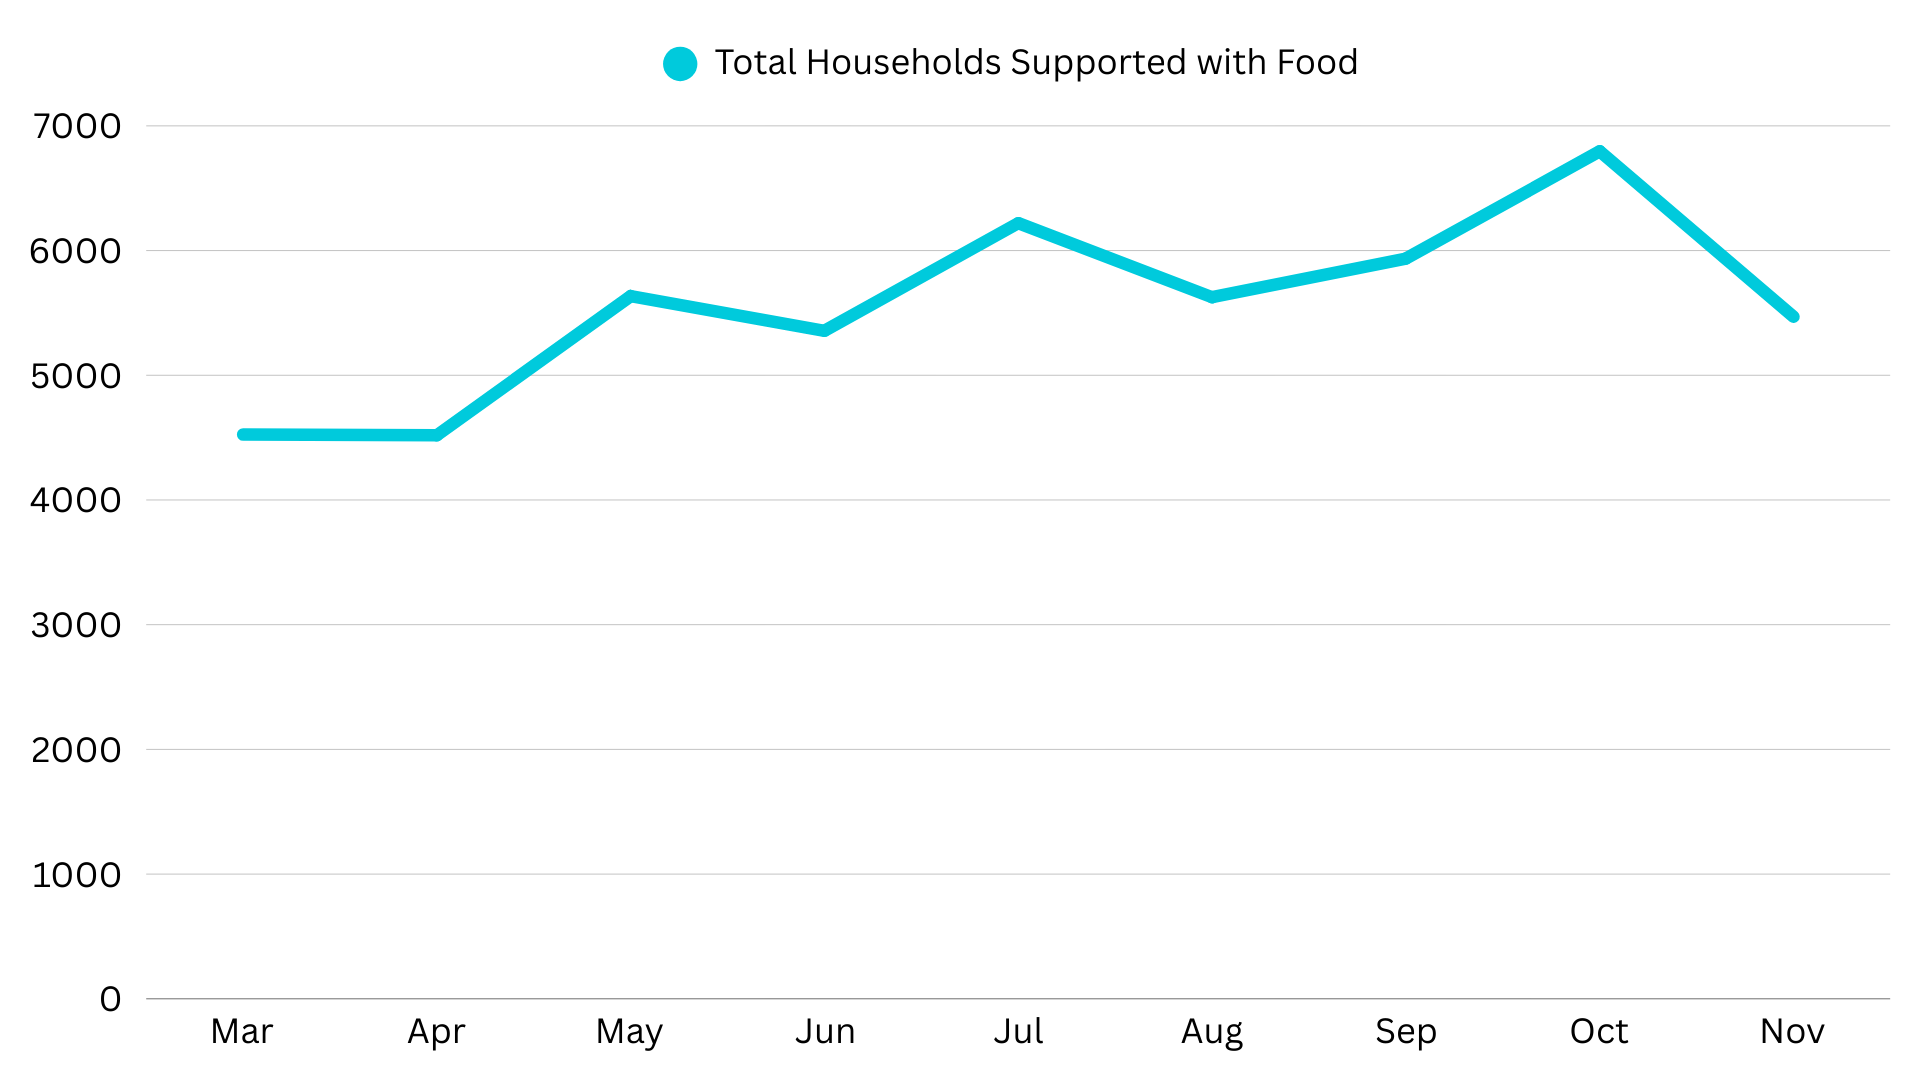
This chart shows the monthly total of individuals supported monthly through food assistance - this doesn’t include community meals.
Our Grocery Service (2025)
Volunteers: The Strength behind our Community
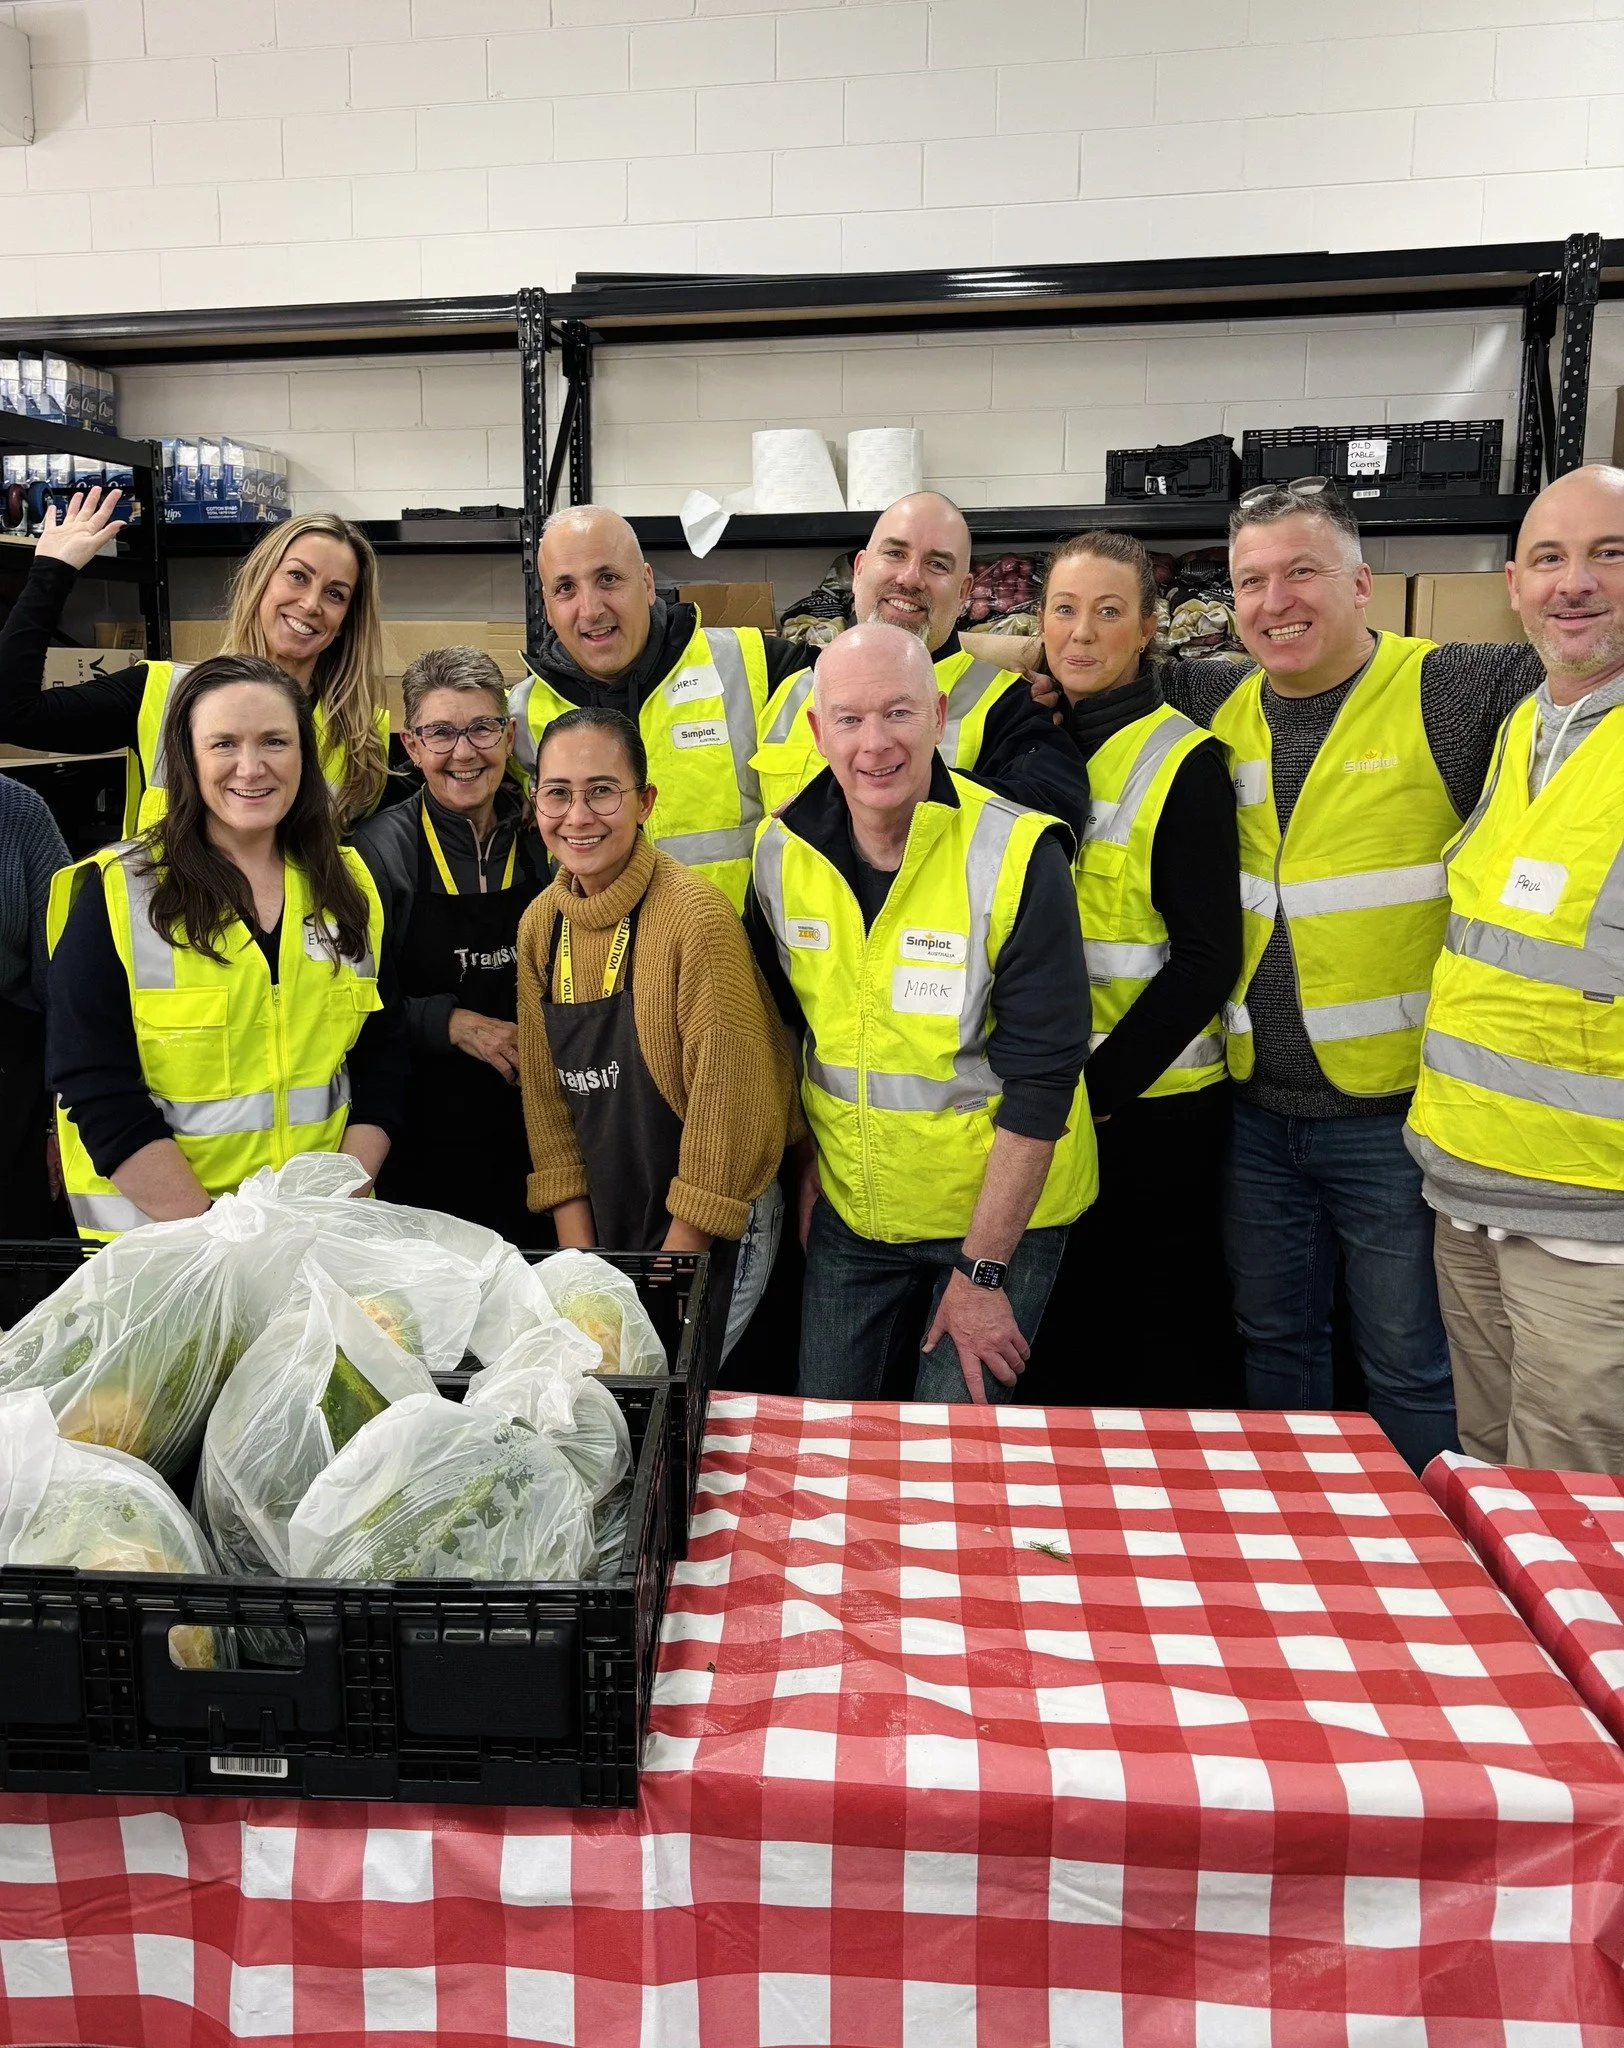
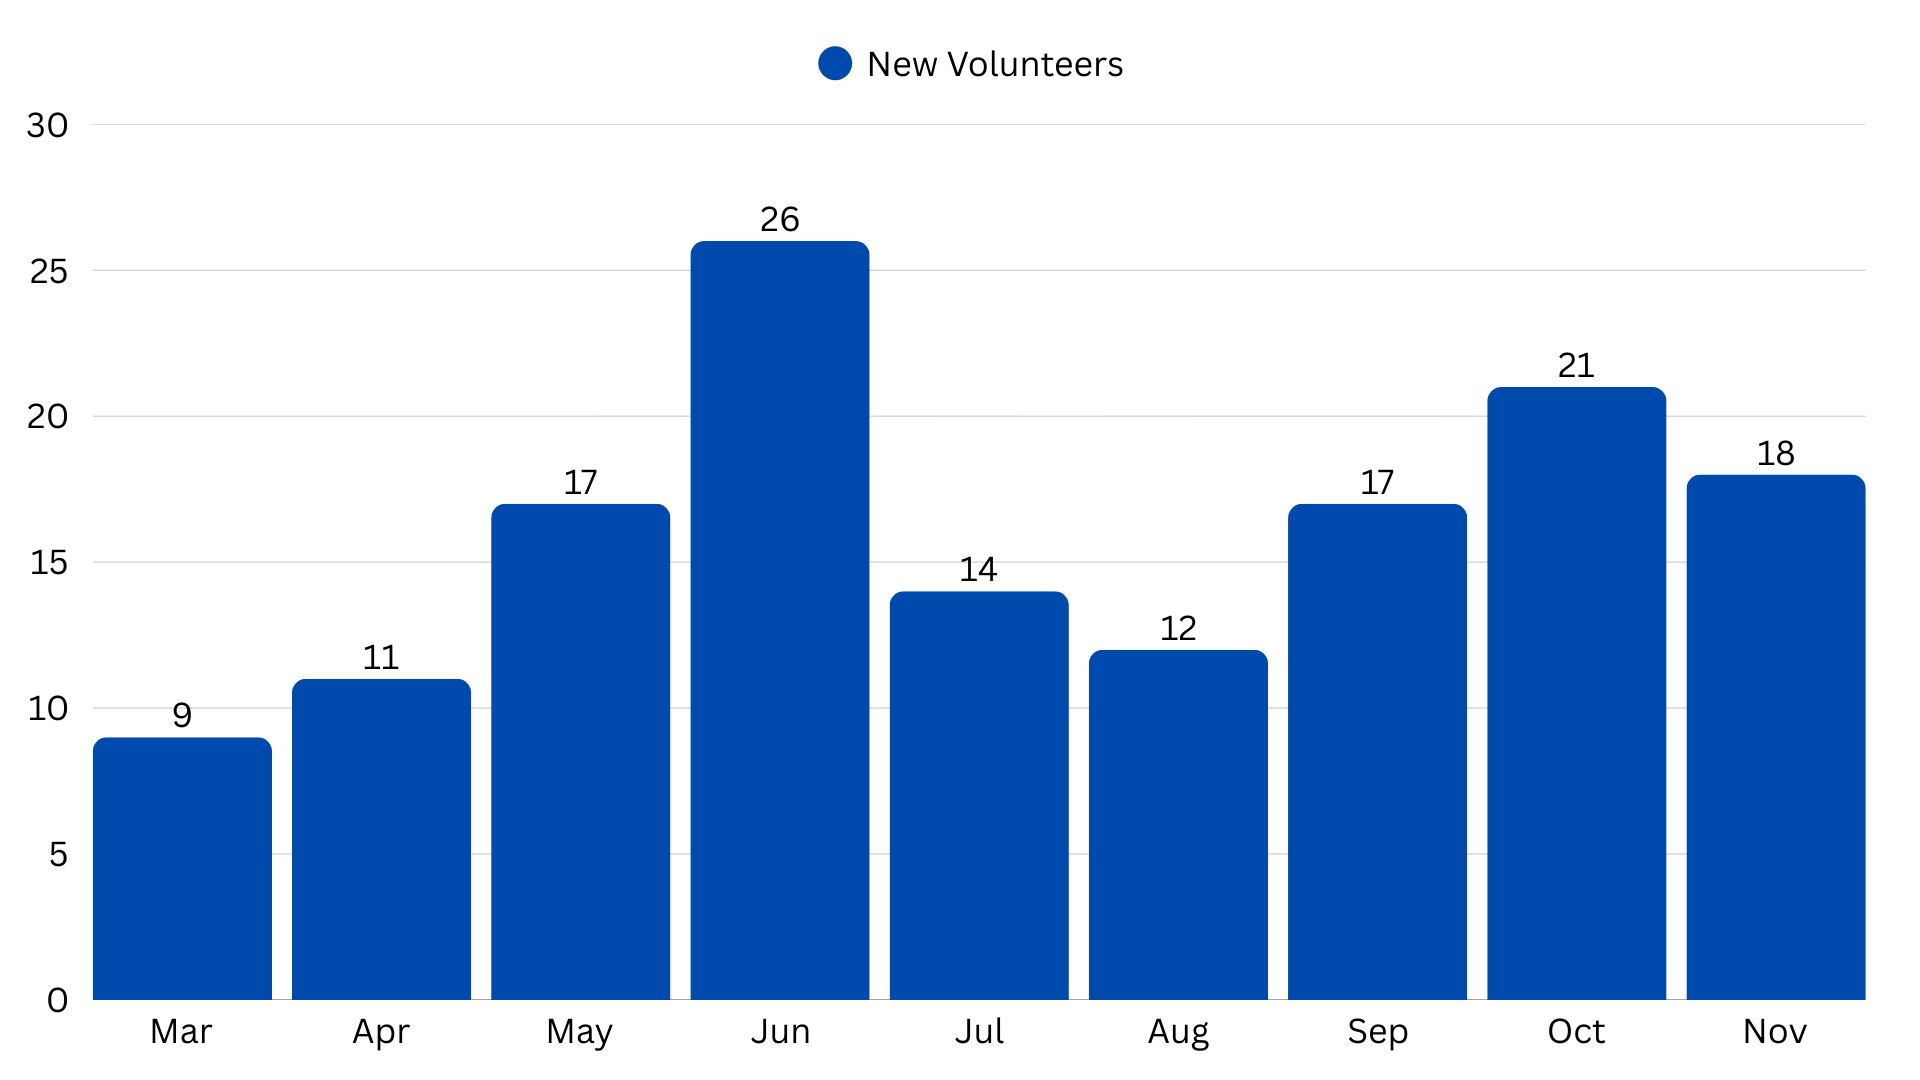
A simple graph showcasing the number of new volunteers becoming part of the Transit Family this year. Volunteers registered with all compliance WWC checks and are provided with training/safety inductions.
New Volunteer Registrations (2025)
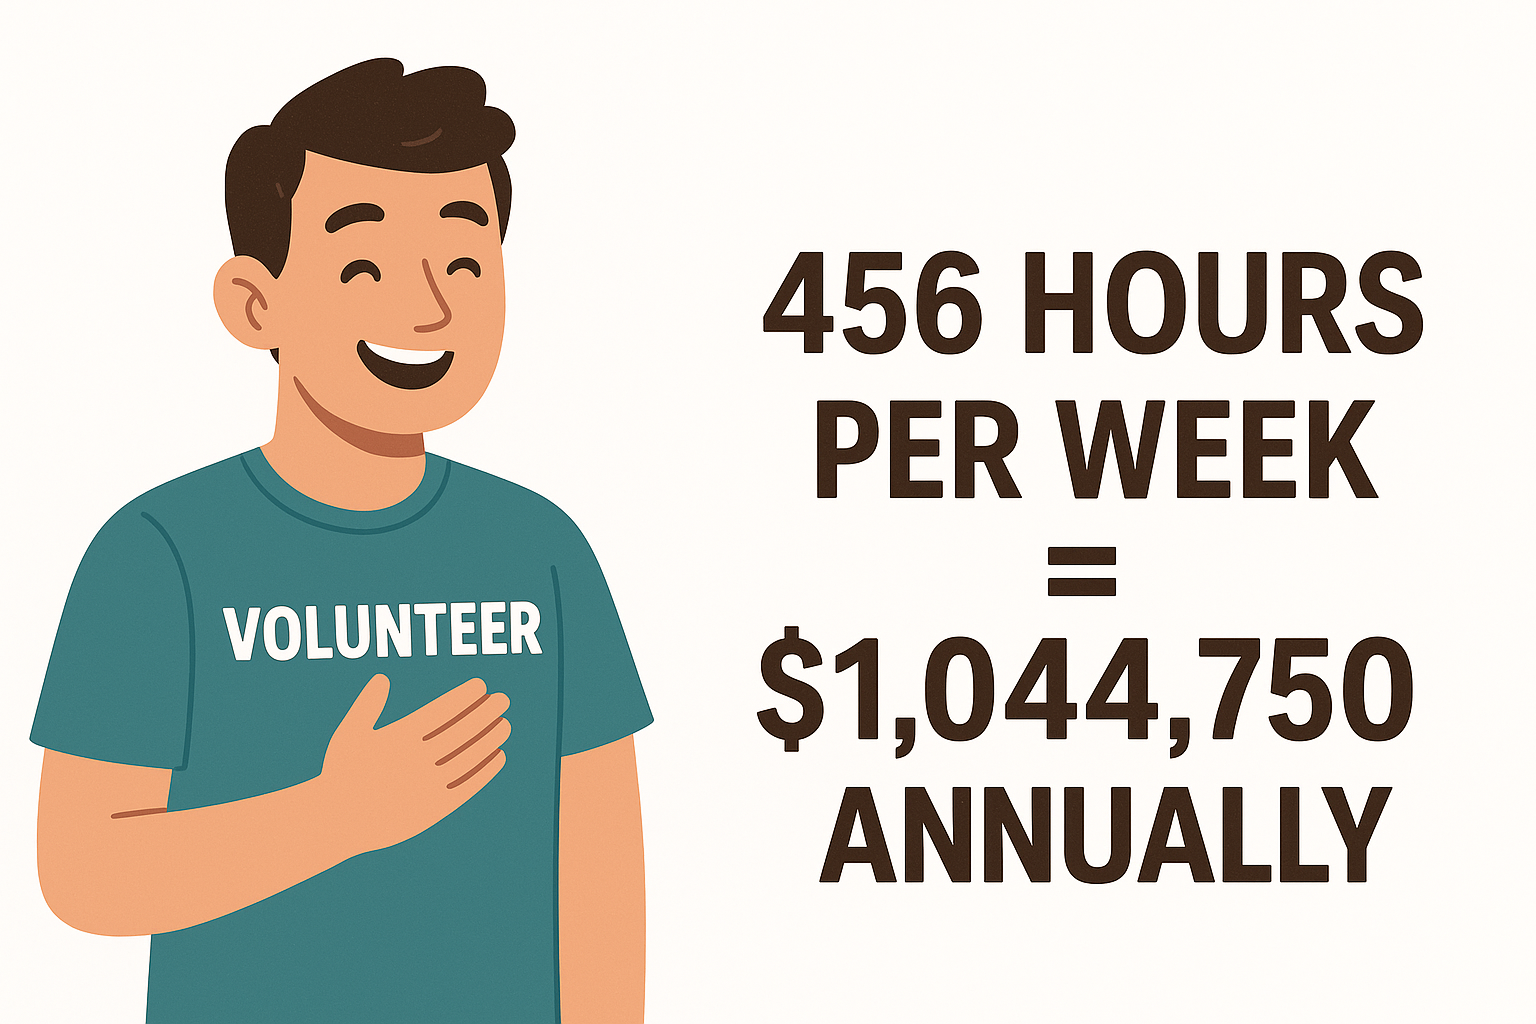
Volunteer Value & Cost Calculation (2025)
The volunteer value and cost calculators estimate the financial cost of hiring paid staff to replace volunteer work.
Reference - Volunteer Replacement Cost Calculator - State of Volunteering